Introduction
When investigating issues, Our Support team may request browser Console Logs and Network Logs to help diagnose the root cause of a problem. These logs can provide valuable information about errors, failed requests, performance issues, and other browser activity that is not always visible on screen. By capturing and providing these logs when requested, you can help our support team analyse the issue more efficiently and reduce the time required to identify a resolution.
Capturing Console Logs (LOG File)
Using Microsoft Edge
- The Console tab displays browser errors, warnings, and diagnostic messages that can help identify the cause of an issue.
- Open Microsoft Edge and navigate to the page where the issue occurs.
- Press FN + F12 on your keyboard to open the browser's Developer Tools.
- Select the Console tab.
- If there are existing messages, select the Clear Console button (🚫) to clear the Console and start with a clean log.
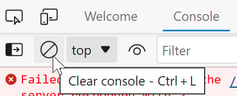
- Reproduce the issue by performing the steps that lead to the error.
- Right-click within the Console and select Save as... to save the log file.
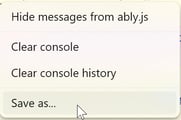
Attach the saved file,when replying to your support ticket.
Using Google Chrome
- Open Google Chrome and navigate to the page where the issue occurs.
- Click the ⋮ menu in the top-right corner of Chrome, then select More tools > Developer tools.

- Alternatively, press Ctrl + Shift + I simultaneously.
- Select the Console tab.
- If there are already messages in the Console, click the Clear Console button (🚫) to start with a clean log.

- Refresh the browser page to reproduce the issue and capture the relevant messages.
- Once the issue has occurred, right-click anywhere within the Console log and select Save as...

- Save the log file and provide it to the support team for further analysis.
Capturing Network Logs (HAR File)
Using Microsoft Edge
- Open Developer Tools by pressing F12.
- Select the Network tab.
- Ensure the Record Network Log button (●) is enabled and showing red.
- Select the Clear button (🚫) to remove any existing network activity.
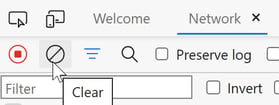
- Reproduce the issue.
- Wait until the issue occurs and all relevant network requests have been captured.
- Right-click Download button

- Save the HAR file to your computer.
- Attach the saved file,when replying to your support ticket
Using Google Chrome
- Click the ⋮ menu in the top-right corner of Chrome, then select More tools > Developer tools.
- Alternatively, press Ctrl + Shift + I simultaneously.
- Select the Network tab.
- Ensure the Record Network Log button (●) is enabled and showing red.
- Select the Clear button (🚫) to remove any existing network activity.
- Reproduce the issue.
- Wait until the issue occurs and all relevant network requests have been captured.
- Right-click Download button

- Save the HAR file to your computer.
- Attach the saved file,when replying to your support ticket
Please email [email protected] and send us these three files:
- screenshot of the issue if possible
- Console log file
- Network HAR file